Event Solutions
Event Stride:
Visualise Impact


Example Dashboards
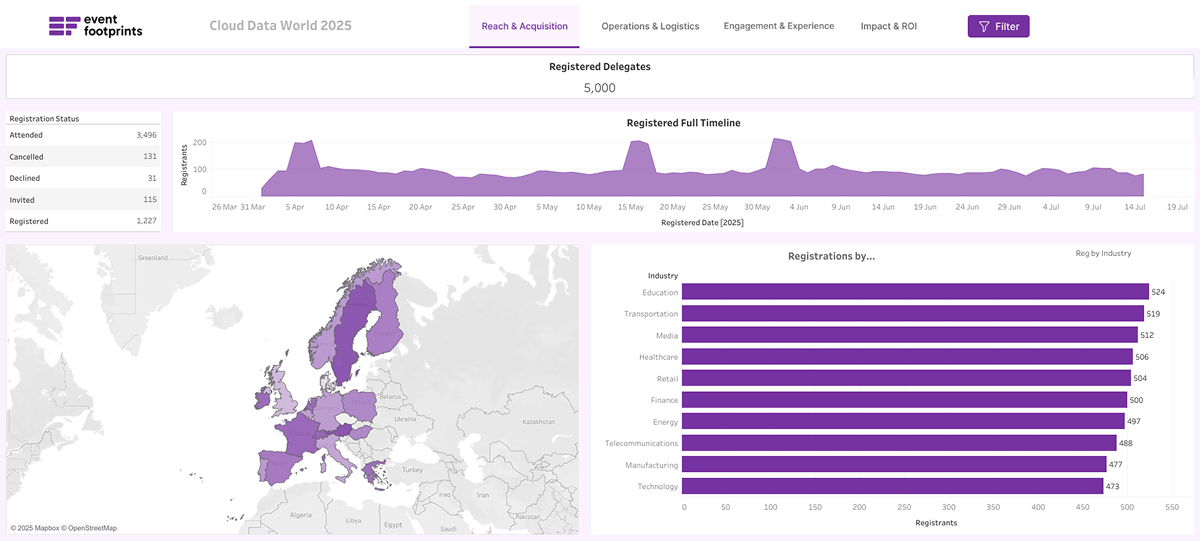
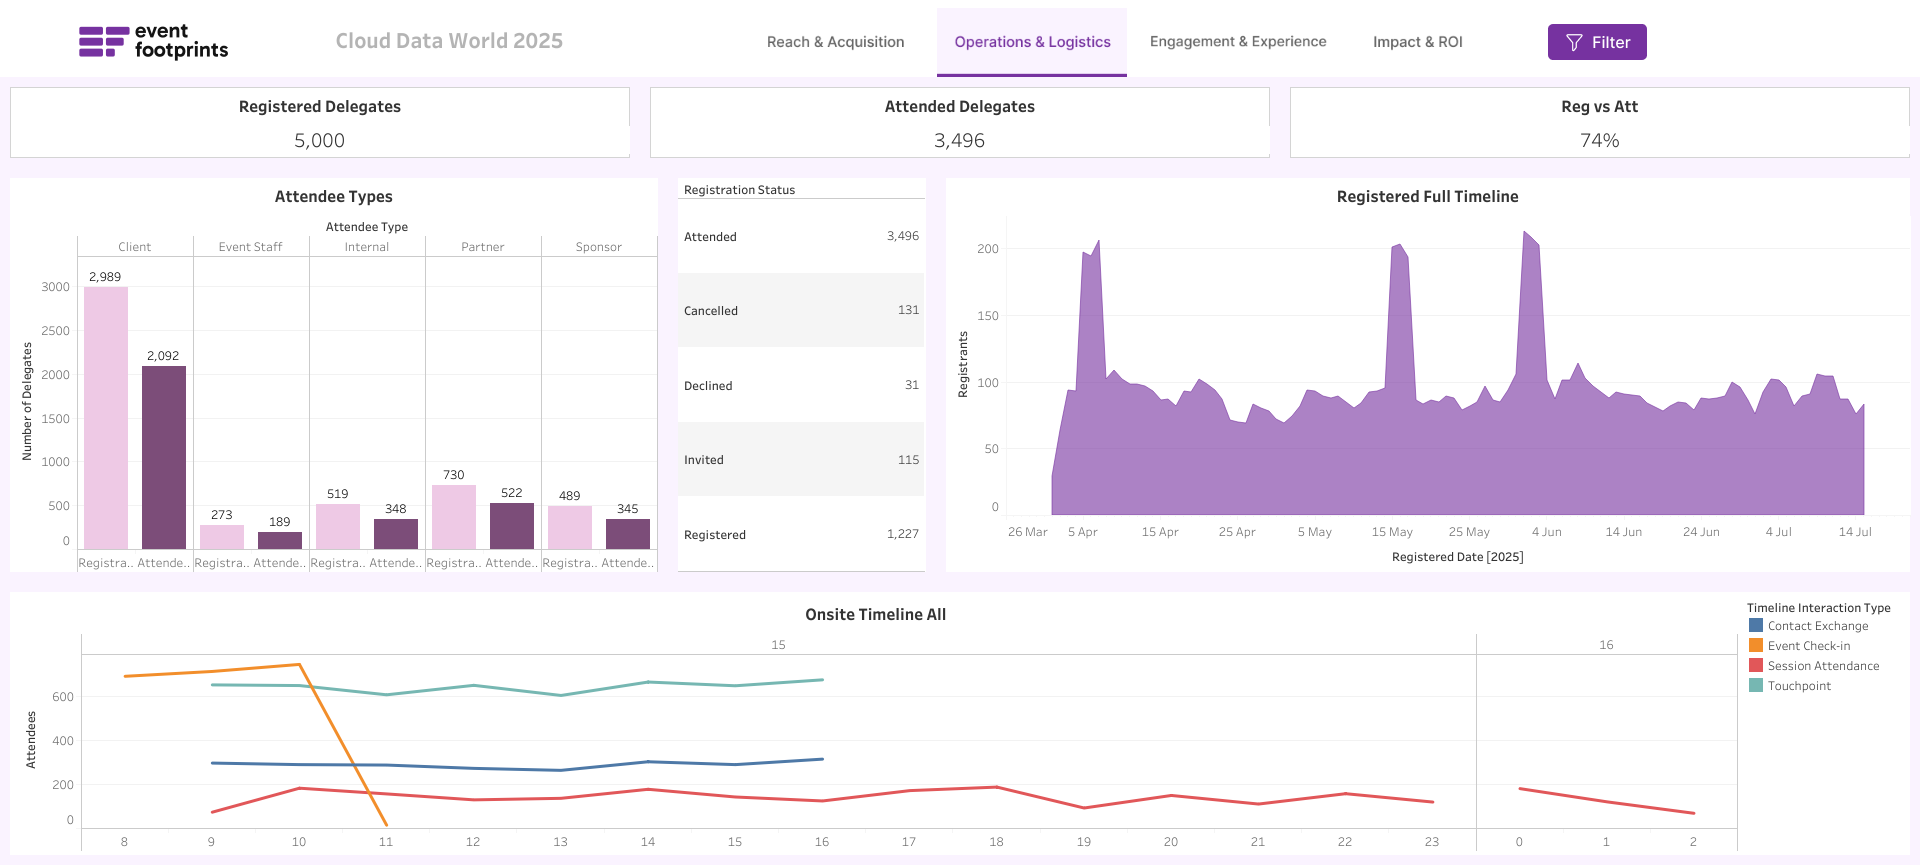
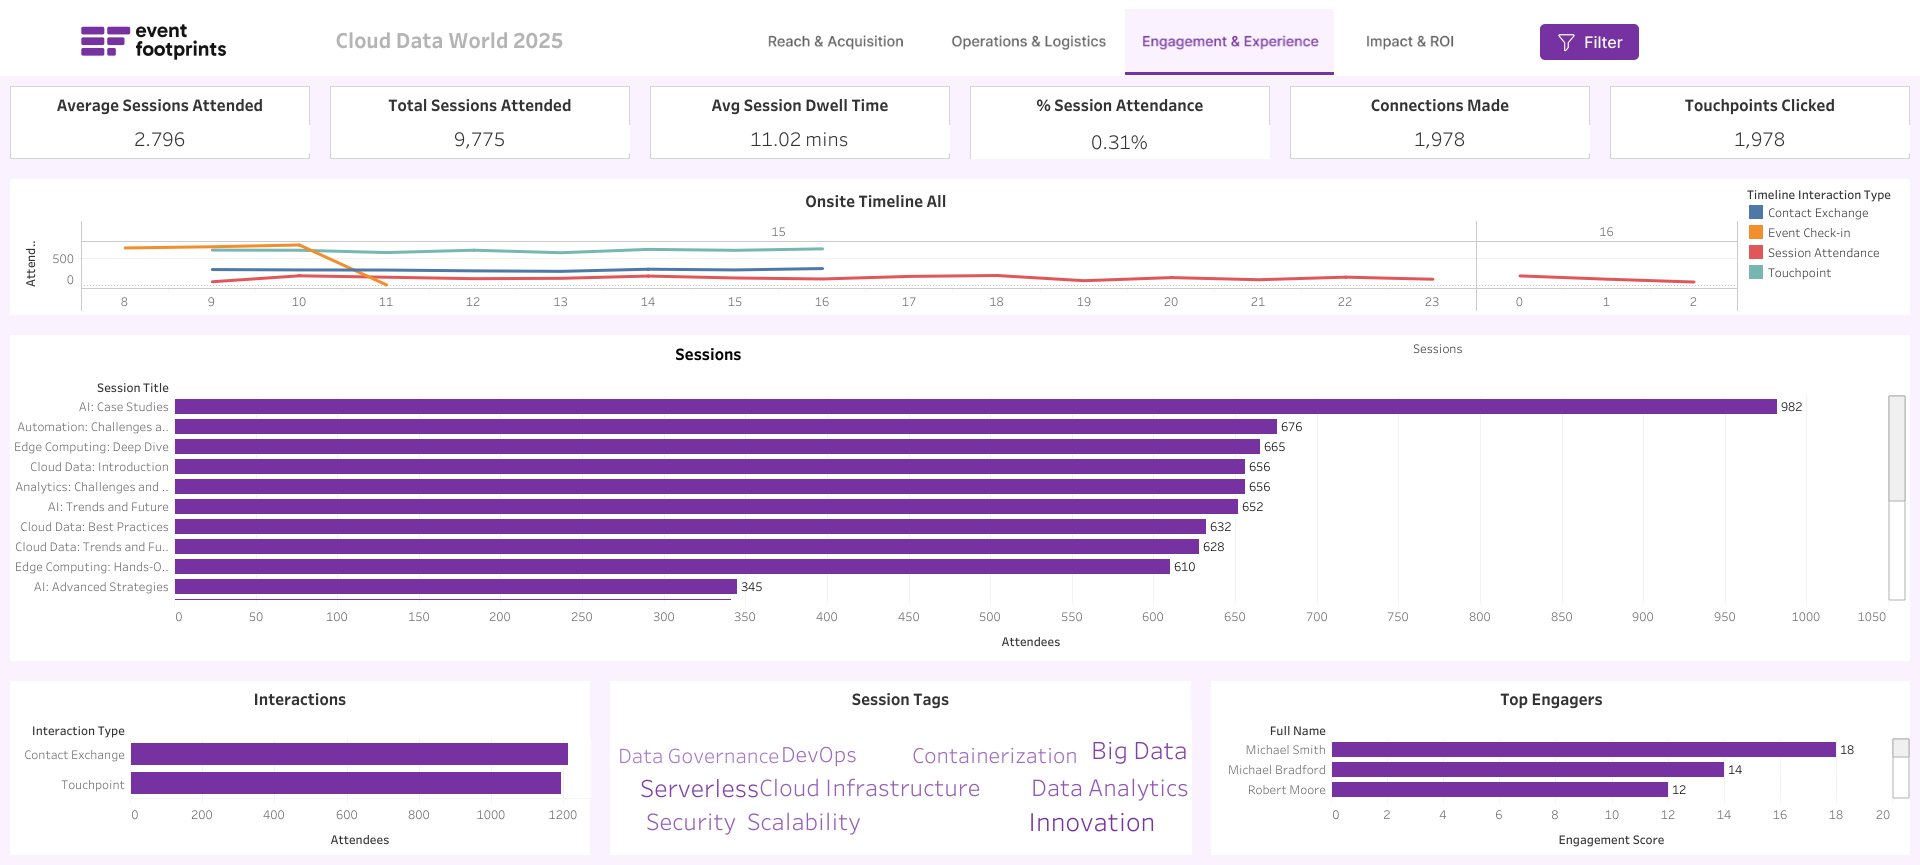
Show how Event Stride tracks each stage of the event lifecycle:
Metrics: Registrations by type, registration timeline, industry, and geography.
Metrics: Registered vs attended delegates, attendee types, registration status, and onsite timeline.
Metrics: Sessions attended, dwell time, session attendance %, connections made, touchpoints clicked, interaction types, and top engagers.
Why It Matters
![]() For event marketers: Show ROI clearly, refine targeting, and benchmark performance across campaigns.
For event marketers: Show ROI clearly, refine targeting, and benchmark performance across campaigns.
![]() For event operations: Track registrations, engagement and logistics in real time, reducing manual reporting.
For event operations: Track registrations, engagement and logistics in real time, reducing manual reporting.
![]() For event agencies: Provide clients with consistent measurement and reporting across every event, without building from scratch.
For event agencies: Provide clients with consistent measurement and reporting across every event, without building from scratch.
Prove your event’s impact while making your life easier
Integrated dashboards: Aggregate data across registration, engagement, surveys, sales and more.
Full event lifecycle coverage: From pre-event campaigns to post-event analysis, track how every touchpoint performs.
Stakeholder-ready reporting: Turn raw data into dashboards and reports that are easy to share across your business.
Customisable views: Tailor insights for marketing, operations, leadership or sponsors so everyone gets what they need.
How It Works
 Step 1 – Connect
Event Stride integrates with your event platforms, CRM, marketing tools and onsite tech.
Step 2 – Standardise
We de-dupe, align and structure your datasets, creating one trusted source of truth.
Step 3 – Deliver
You get clear dashboards, programme reports and recommendations that guide smarter event decisions.